MRTGのディスク使用率のグラフの不具合が直りました。
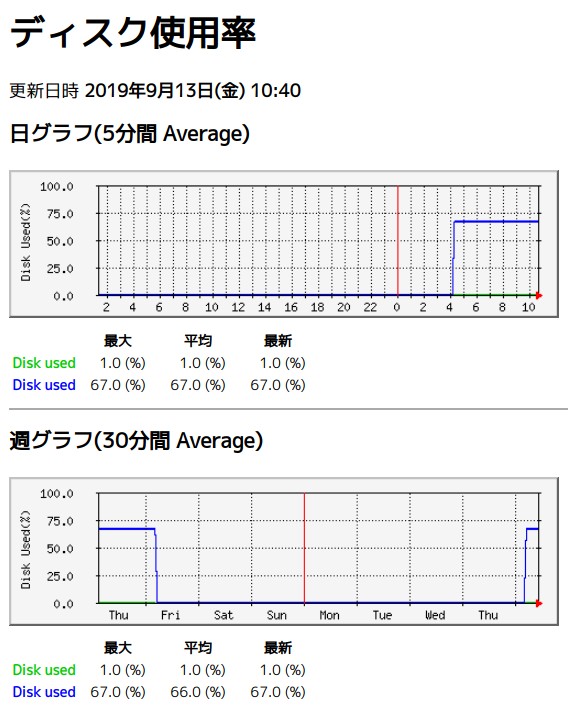
本日午前4時辺り、つまりは、自動アップデートを行なっている時間に、MRTGのディスク使用率の不具合が直りました。
バグフィックスして頂いた皆さん、どうも有り難うございました。
さて、珈琲でも入れますかね。ホッホッホ。
Linux Mint、elementary OS、Zorin OSを応援しましょう!

本日午前4時辺り、つまりは、自動アップデートを行なっている時間に、MRTGのディスク使用率の不具合が直りました。
バグフィックスして頂いた皆さん、どうも有り難うございました。
さて、珈琲でも入れますかね。ホッホッホ。
こんばんは。
MRTGのDisk使用率のグラフが0%になってしまいました。
これは、VPSだけがおかしいのではなく、手元のパソコンのLinux MintのMRTGも、同じ先週の金曜日から0%になってしまっています。
MRTGのディスク使用率に関するプログラムが、どうにかなっちゃったのかもしれません。
これは、私の直感では、放っておくしか無いと思います。
運が良ければ、バグフィックスされて直るかもしれませんね。
VPSのディスク使用率が、どうしても見たい人は、MUNINのDisk使用率のグラフをどうぞ。
それでは、ごきげんよう。

下図は、MRTGの今年のメモリのグラフです。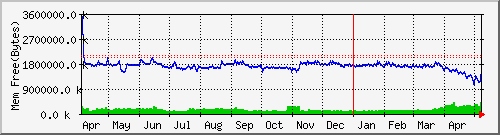
お蔭様で、ホームページ、ツイッターの公開する情報量が増えてしまっていたので、
その公開の情報量を減らしていくと、このVPSサーバーの容量のまま、
使い続けることができると思いまして、
サーバーの設定などを、大幅縮小しました。
今現在のMRTGのメモリ状況は、下記URLからどうぞ!
http://thanks.linuxparadise.net/mrtg/mem.html
2016年5月9日 午後7時0分現在、メモリの状況は、安定しております。
今後も、サーバーに負担をかけず、運営してまいりたいと思います。
今後とも、KOUJIの運営するサーバーを、どうぞ宜しくお願いします。
MRTGのグラフは正常に戻しました。
原因は恐らく、Dropboxだったと思います。
さて、次は、MUNINのpostfixですね。
これがまた、スパマーさんが困ったことをしてくれるんですよね。
今、対応しておりますよ。
Red5と、Gnump3dは再起動させております。
ご迷惑をお掛けしました。